Let's face it, the way some companies still do their forecasting is, frankly, scary. We’ve seen it firsthand—a lot of people just take last year's numbers, add a dreamy 50% on top, and call it their growth target.
Sounds familiar, right? This kind of back-of-the-napkin math is exactly what you don't want to do.
Here’s the deal: if you're in the food and beverage business, getting your demand modeling right isn’t just good to have—it's critical. It’s your roadmap for how much money you’ll make and spend, and guess what? It determines if you’ll hit the big revenue numbers you’ve promised everyone.
In this blog post, we're diving deep into demand modeling done right. We'll break down the nuts and bolts of a solid model covering all your bases—from figuring out your hot and low seasons to ensuring what’s in your bank matches what you modeled. No more guessing games, just clear, actionable strategies that align your financial goals with real-world data.
In this blog post, we will reveal the insider secrets of demand modeling:
What Many People Think Forecasting Is Like
It's surprising how often we encounter seasoned professionals, who still rely on a straightforward but risky modeling approach:
- Determine the growth target for the year.
- Add a hopeful 50% to last year's numbers.
- Consider the plan set.
While this method might seem quick and simple, it tends to overlook the complexities of market dynamics and may lead to many problems. Whenever we hear this from a lead or a client, it signals a need for a deeper conversation about adopting more robust, data-driven forecasting techniques that better prepare us for the realities of the market.
I get the temptation to take the easy way out. Forecasting demand can be a complex beast, and it's natural to want a quick fix.
But here's the harsh truth:
| "Not having a proper Demand Model is a sure way to miss your targets, disappoint your boss, and watch your stock price (and credibility) plummet faster than a poorly risen soufflé." |
Real Talk: Why This Doesn’t Work
Let's break it down. When you just inflate last year’s numbers, you’re assuming the market hasn’t changed. No new competitors, no shifts in consumer behavior, no economic downturns. Sounds unrealistic, right? That’s because it is. The market is a living, breathing thing. It changes, and so should your strategies.
Remember when COVID hit, and all our demand models broke? That's because we didn’t factor in the crazy market changes and economic chaos that came with a global pandemic. But if you've got a solid demand modeling process backed by data, you can factor in those wild scenarios and still stay one step ahead, even when crazy stuff hits the fan.
Plus, the +50% method ignores any internal changes your business might have gone through. New product lines? Changes in your supply chain? Shifts in your target market? All these need to be factored into your model. Ignoring them would not just be an oversight; it would be a miss that can cost you big time.
| "By simply adding a percentage to last year's numbers, you fail to account for critical variables such as market saturation, competitor actions, changes in consumer preferences, and economic downturns." |
Risks of Poor Demand Modeling
In competitive sectors like food and beverage, staying ahead means adapting swiftly to changes and innovating continuously. Here are several risks of oversimplified or inaccurate demand modeling:
| Type of risk | Financial Risks | Market Risks | Operational Risks | Competitive Risks |
| Effect on business | - Tied up capital - Increased costs - Poor cash flow - Financial instability | - Customer dissatisfaction - Lost sales - Lost market share - Brand damage | - Inefficiencies - Misallocations - Increased costs | - Poor strategic decisions - Loss of innovation - Vulnerability to market disruptions |
| How it happens | Inaccurate forecasts cause financial strain by either overestimating demand, leading to excess inventory & high holding costs, or underestimating demand, causing stockouts, lost sales, & rushed restocking fees. | Without considering potential adverse conditions, companies can find themselves unprepared for downturns or unexpected shifts in the market. | Due to inaccurate forecasts, investments might not be directed toward channels or products that genuinely need them or are ready to scale. | A demand model without detailed competitor analysis & market trends can leave a business lagging behind its more agile and data-savvy competitors. |
Keeping in mind all the potential risks of poor forecasting, in the next sections, we will discuss what a good demand model is like, and how it can be used. We’ll show you the ropes on how to model the right way—no more guesswork, just smart, informed strategies that will help you scale your business.
What Is a Good Demand Model?
Before we dive into the usage and the process of creating one, let’s define demand model.
| "A demand model is a structured, data-driven approach that helps you plan effectively, align efforts, continuously improve, & ensure your investments are paying off." |
For food and beverage companies leveling up their e-commerce game, nailing demand modeling is key. In this industry, margins can be super tight and are easily knocked off balance by changes in supply costs, shifts in what customers want, or how your competitors price their products.
Let’s face it: You live and die by your margin. In other words, keeping your profit margins healthy is absolutely critical for your business's survival. That's why having an effective demand model in place is essential for keeping your margins in the green and your business in the black. It’s all about smart planning and keeping a close eye on your numbers.
| "Good demand modeling means you're not just taking wild guesses; you're smartly navigating potential market ups and downs, unexpected global events, and even sudden spikes in demand to put your resources where they count the most." |
Think of it as a crystal ball in your hand—helping you figure out where, when, and how to invest every dollar for maximum return. A demand model gives you the ability to see if you're heading into a busy season or a slow one, understand the dynamics of upcoming months, and adapt your strategies accordingly.
Interested in discovering how other decision-makers and marketing strategists use demand models? Keep reading, as we're going to reveal the insider secrets in the next section.
How to Use the Demand Model Effectively
How does this demand model actually function in your hands? Here’s a breakdown of how to put it to work:
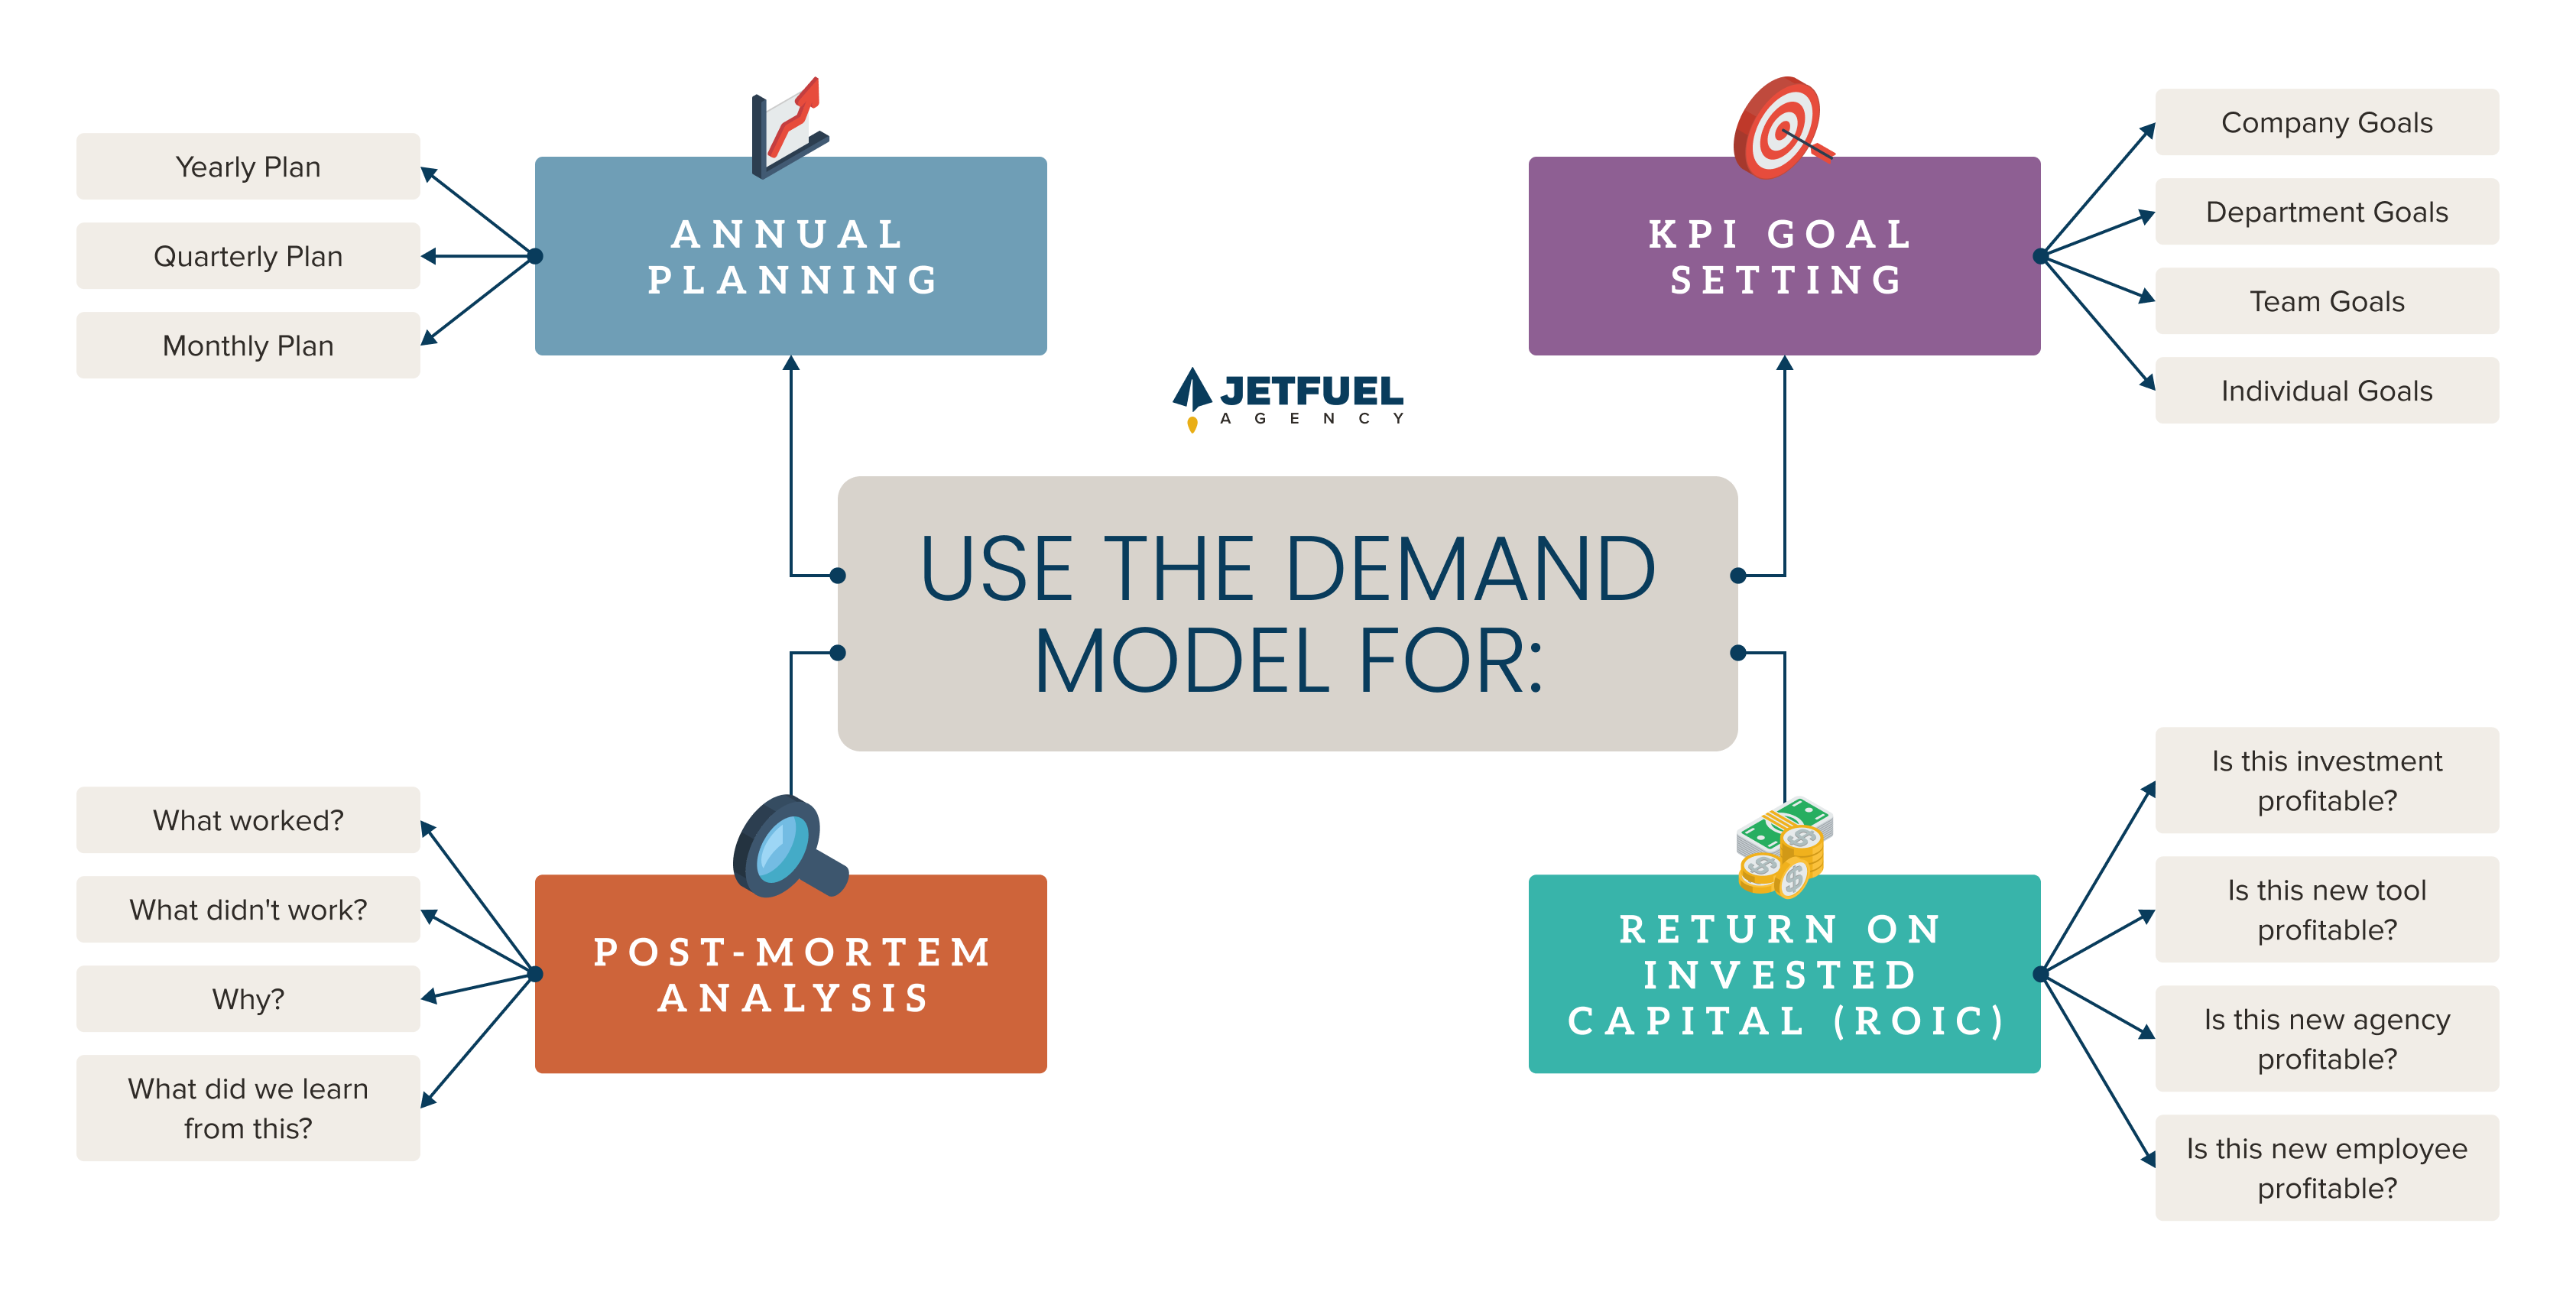
1. Annual Planning
Break down each yearly plan into quarterly and monthly chunks. This helps your team, partners, & agencies work towards smaller, more manageable goals that add up to your big annual target.
2. KPI Goal Setting
Every department, team, and individual needs a clear KPI goal. These smaller goals should align perfectly with the company’s overall objectives.
3. Post-Mortem Analysis
Regularly look at the channels that missed their targets. Figure out why, & plan how to course-correct. This helps continuously improve your strategies & stay on track.
4. Return on Invested Capital (ROIC)
Constantly evaluate the ROI. Every new team member, agency, or tool you bring on board needs to prove its worth. Make sure every investment is contributing positively to your bottom line.
Businesses need to not just hit their margin targets but beat them. By sharpening your demand modeling skills to better handle the ups and downs of market trends and operational snags, you can stay competitive and keep your business thriving in a tough market.
Now, let’s dig into the top techniques for crafting a demand model that doesn’t just guess the future but really gets it right, syncing up tightly with your strategic business plans.
Step-by-Step Demand Modeling Process
What does a killer demand modeling process look like? We're talking accurate revenue projections, precise budget allocations, and the ability to see into the future (well, almost). By adding this level of flexibility and foresight to your model, you're not just preparing for the unexpected—you're setting yourself up for ongoing success.
Here’s an example of how one of our client's Demand Models looks like:
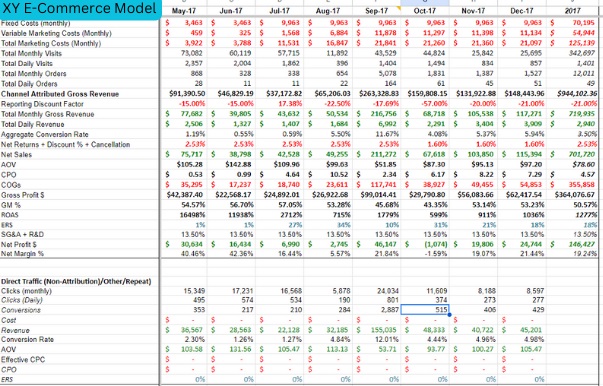
In order to create such a detailed forecast, you can follow these 3 steps:
- Learn from History to Predict Demand
- Set Goals & Make Assumptions
- Align Platforms & Stakeholders
Let's now dig into each of these steps in full detail.
1. Learn from History to Predict Demand
Before starting anything else, it’s time to take a deep dive into your historical performance data. For easier visualization, here’s an illustration of the segments that every business should be analyzing for their reports as well as forecasting:
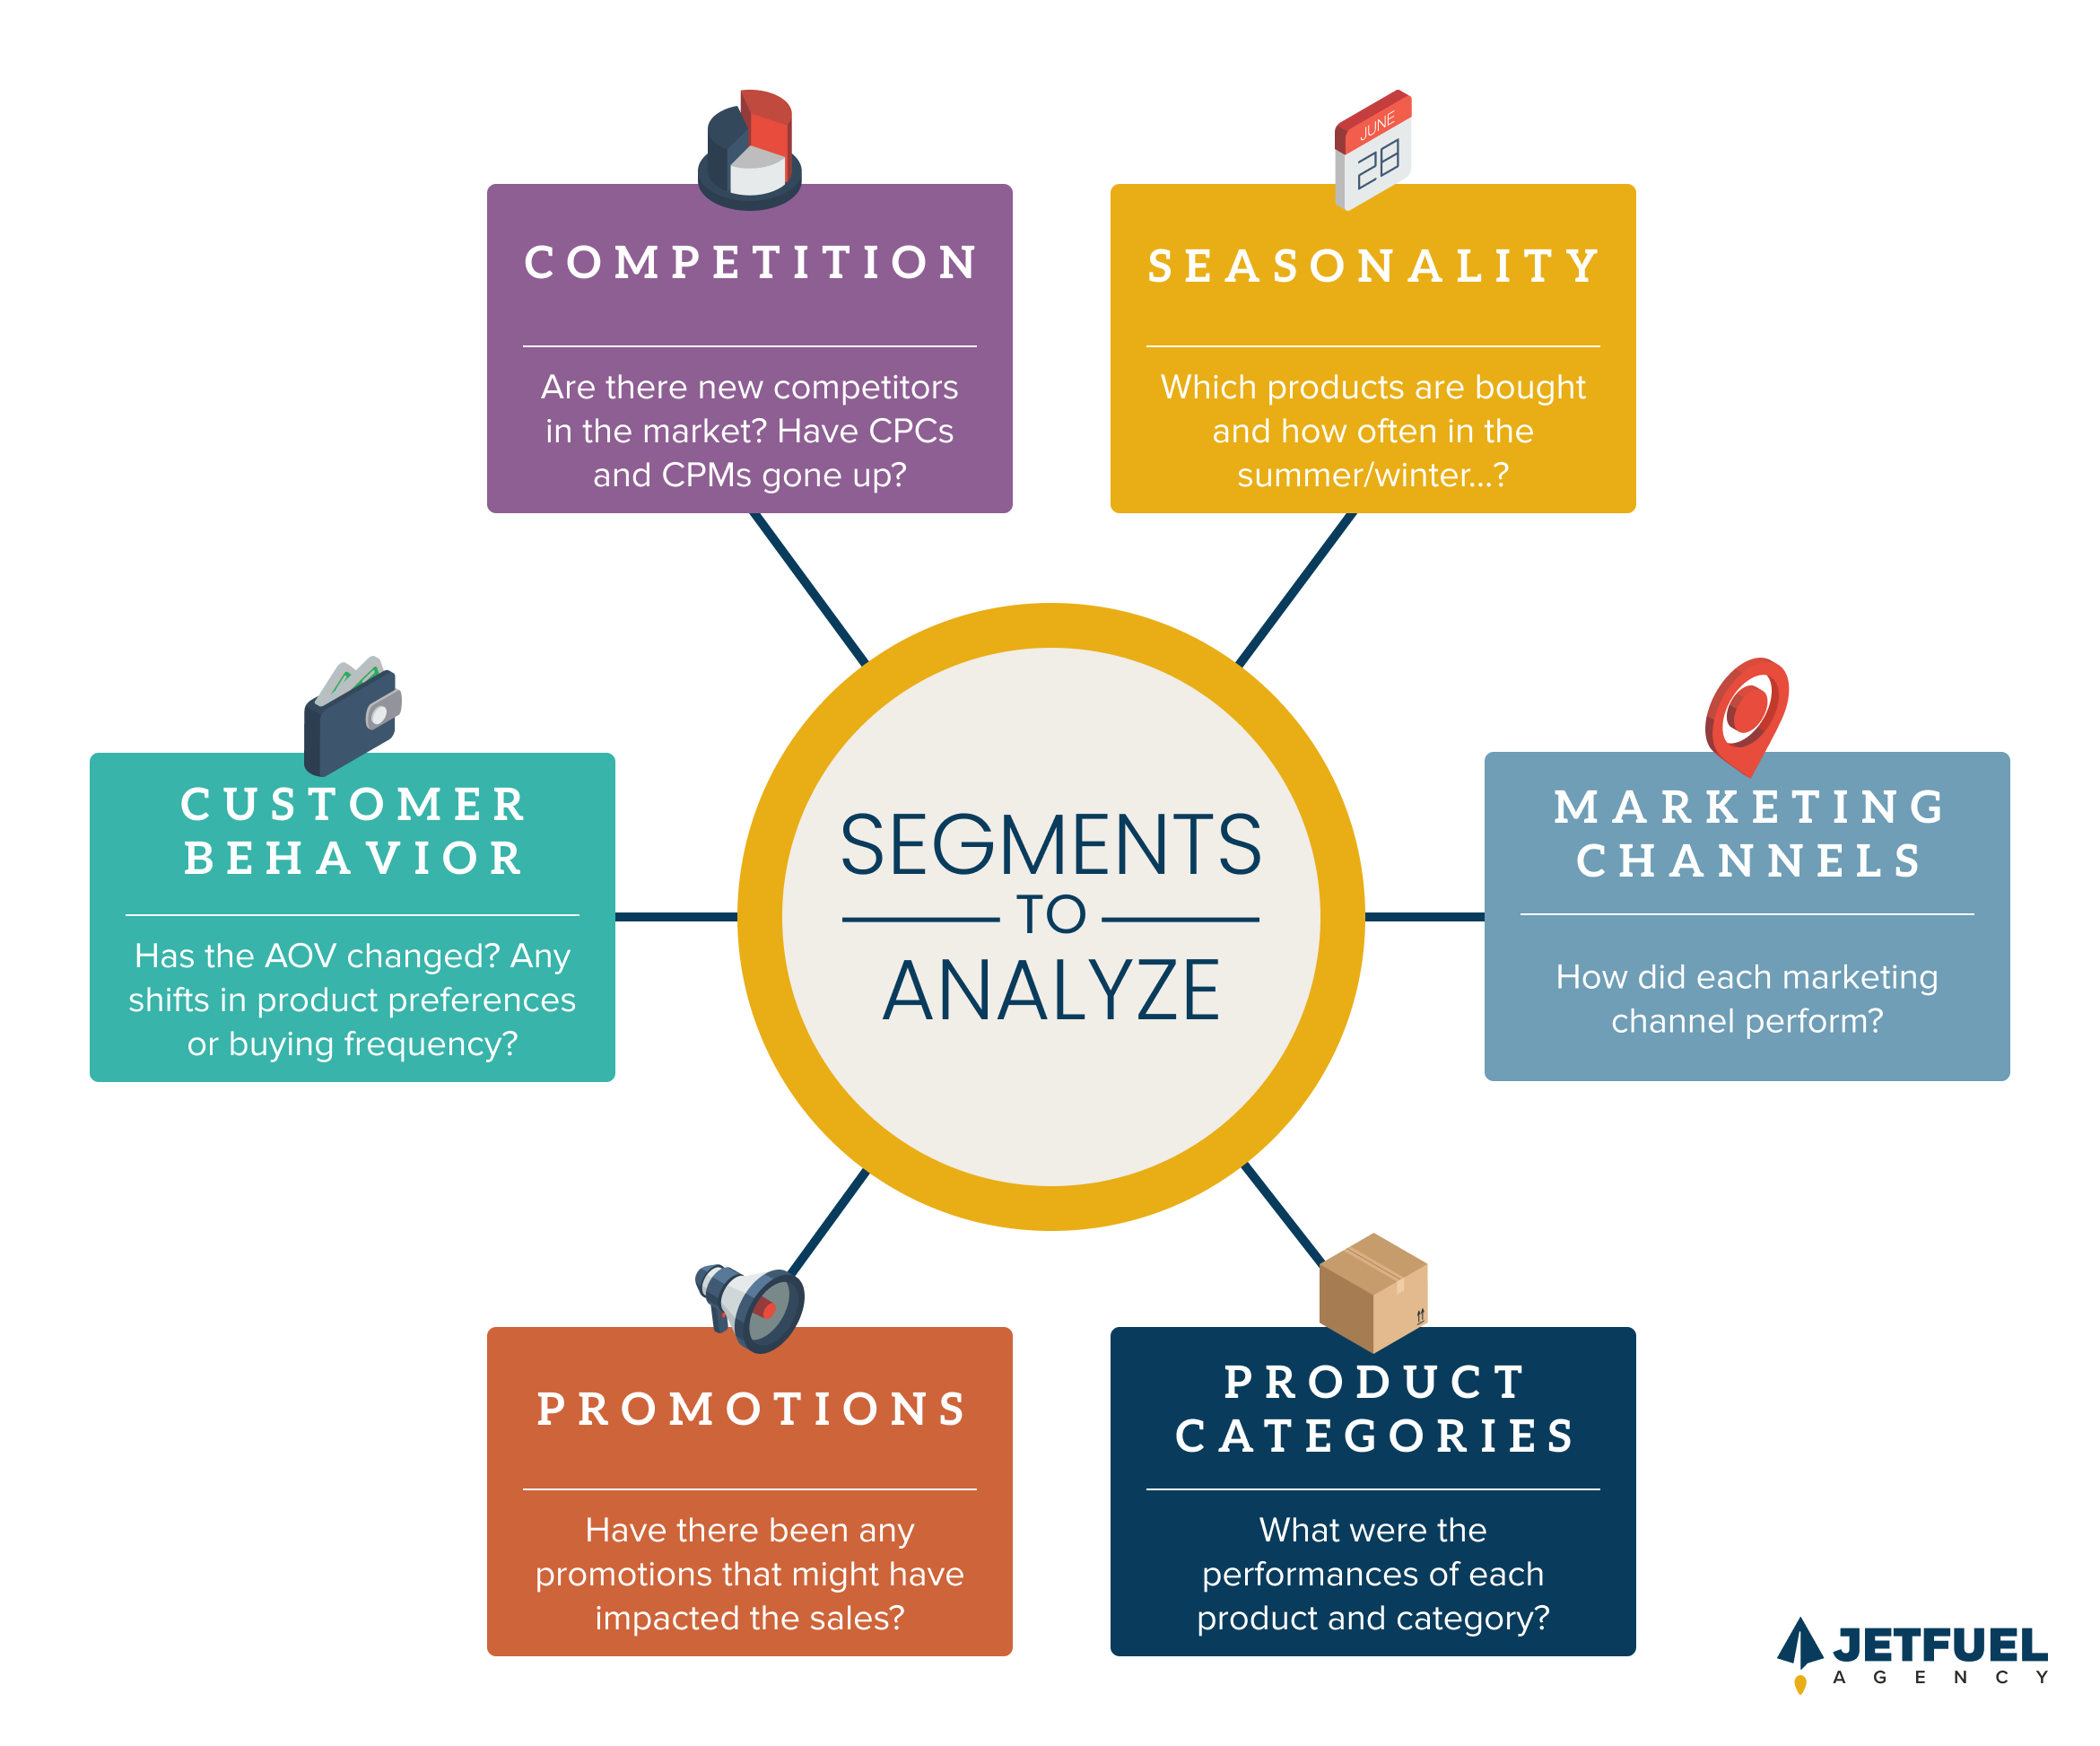
Each of these segments will be further elaborated in this section. It’s important to look into each of them to be able to interpret the numbers and truly understand which factors can influence your business. Then, you will be able to make assumptions and forecast the next year and back all your assumptions with data.
But, first, you need to take all your numbers and put them into a table. Gather all your historical data that spans several years. The more data, the better. Include sales volumes, website traffic, conversion rates, revenues, and any other relevant metrics for your business.
Then, break down this data month-by-month and build in two calculations: month-over-month and year-over-year, to easily identify cycles and trends that will influence your forecasting.
Here’s an example of how we compare month-over-month deltas:

At this point, you might spot a historical trend where going from December to January, the sales tend to drop by about 24% every year. December is usually a super-hot month, unlike January, which is usually a slow month for most businesses (unless you’re in the snow removal or winter traction!).
Also, if you look at the last five years, you might notice that January sales have been growing by about 12% each year. Maybe your brand has been gaining more attention year after year, and you’ve managed to build more trust among your audience and expand your audience pool.
This is how you should always be interpreting the deltas and connecting the numbers to various internal and external factors.
Marketing Channels
Another important angle is to analyze your data channel by channel. Keep in mind that every channel has its own personality. SEO, for example, is a super-slow channel. If you want to hit the 50% growth for the year, and you’re planning to put it on the back SEO — that’s going to be highly unrealistic. Meta and PPC have very different behavior, which should be reflected in your forecast for those channels.
Here’s what metrics you can observe, for each individual channel:
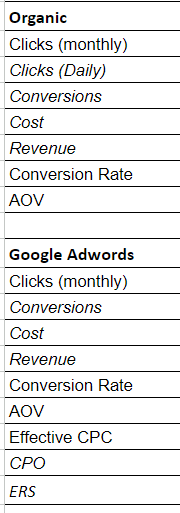
As mentioned above, it’s not just about the numbers. It’s important to understand the story behind these numbers. Look for patterns, trends, and anomalies in your data over multiple periods and consider external factors such as market trends, economic conditions, and competitive landscape. This historical analysis will provide a solid foundation for forecasting future demands.
Seasonality
Moreover, identifying seasonal trends and fluctuations in demand will help you anticipate peak periods and adjust your inventory and marketing strategies accordingly. For food and beverage companies, this might include higher ice cream sales in summer or increased demand for baking products during holiday seasons. If you need a more detailed list of seasonal trends in the food and beverage industry, you should check out this blog post.
Here’s a Google Ads dashboard example of a client selling winter seasonal products, where the revenue goes up to $43k in January, while it drops to $2k during the summer months.

For this client, it would probably be the wisest to invest the biggest portion of his marketing budget during the colder months, from October or November until February. Combining smart investment pace with new creatives, platforms and strategies, they would be able to maximize their ROI and boost their revenue, achieving bottom-line growth. During slower months, we would probably advise them to invest moderately into finding new customers interested in their summer-related products.
Products Categories
To get a clear picture of your product categories and their performance, start by analyzing your sales data. Look at metrics like total sales, sales growth, and average order value (AOV) for each category. Tools like Google Analytics and your e-commerce platform’s analytics can help identify which products are top performers and which ones are lagging. Keeping track of inventory levels with management software ensures you avoid overstocking or stockouts, helping maintain optimal stock levels for high-demand items.
Pay attention to seasonal trends to understand when certain products sell best. For example, your top-seller product in the fall is pumpkin-flavor chocolate, and your trick-or-treat packs have boosted your sales by 25% around Halloween each year. If these products worked well historically, that can be a good reason to plan for them the next year and include them in your demand model.
Customer Behavior
Understanding customer behavior is crucial for tailoring your strategies effectively. Start by collecting and analyzing data with tools like Google Analytics and social media monitoring platforms such as Hootsuite. These tools track customer interactions on your website and social media, revealing patterns like page views, time spent on pages, bounce rates, and conversion rates. By examining this data, you can identify customer preferences and sentiments, allowing you to adjust your marketing strategies accordingly.
Moreover, customer surveys and feedback provide direct insights into what your customers think and feel. Use tools like SurveyMonkey and Google Forms to gather and analyze survey data. Metrics like the Net Promoter Score (NPS) help measure customer loyalty by asking how likely they are to recommend your product or service. Also, analyzing purchase history helps refine this understanding by identifying buying patterns, preferred products, and average order values. Basket analysis can highlight opportunities for cross-selling and upselling by showing which products are frequently bought together.
Segmentation and journey mapping are also essential for understanding customer behavior. Group your customers based on demographics like age and income, or behaviors like purchase history and loyalty status. Mapping the customer journey, including all touchpoints and website paths, helps identify pain points and opportunities for improvement. Additionally, A/B testing with tools like Optimizely allows you to experiment with different versions of web pages or emails to see which performs better, providing insights into user experience and behavior. By combining these methods, you get a comprehensive view of your customers, enabling you to improve their experience and increase loyalty.
Promotions
Before making other conclusions, consider the impact of promotions you were running in that period. To see how your marketing promotion is impacting your business, start by tracking key performance indicators (KPIs) like sales volume, customer acquisition rates, and website traffic before, during, and after the promotion. Look at how these metrics change to gauge the promotion's effectiveness. Also, check customer engagement metrics like click-through rates, social media interactions, and email open rates.
Tools like Google Analytics can help you break down this data by demographics and behavior to see which customer groups responded best. Finally, compare the cost of the promotion against the revenue it generated to evaluate your return on investment (ROI). This thorough analysis will show you how well the promotion worked and guide your future marketing strategies.
Competition
To understand how changes in competition are affecting your business, start by checking your market share over time. If you notice a dip, it might be due to new moves from your competitors.
Here is an example of a Google Ads Auction Insights report where we were able to track competitor activity and compare the ranking with our account.

Use tools like SEMrush or Ahrefs to compare your sales figures and customer acquisition rates with theirs. Pay attention to what customers are saying about you and your competitors on social media and review sites. If they're praising your competitors more, that's a sign you need to watch out for. Look at your sales data and see if any drops align with competitors' big campaigns or new products.
Finally, regularly do a SWOT analysis to see where your competitors might be gaining an edge and where you can improve. This way, you can stay ahead and respond quickly to any market changes.
Other External Factors
The market doesn’t exist in a vacuum, and neither does your business. It's essential to consider both macro and micro-economic factors that could impact your market. This includes everything from global economic conditions and industry trends to local events and seasonal fluctuations.
For food and beverage companies, staying attuned to external forces is not just beneficial—it's essential. These dynamics can significantly influence consumer behavior, demand patterns, and overall market stability.
Let’s look at how some specific external factors can impact the food and beverage e-commerce sector:
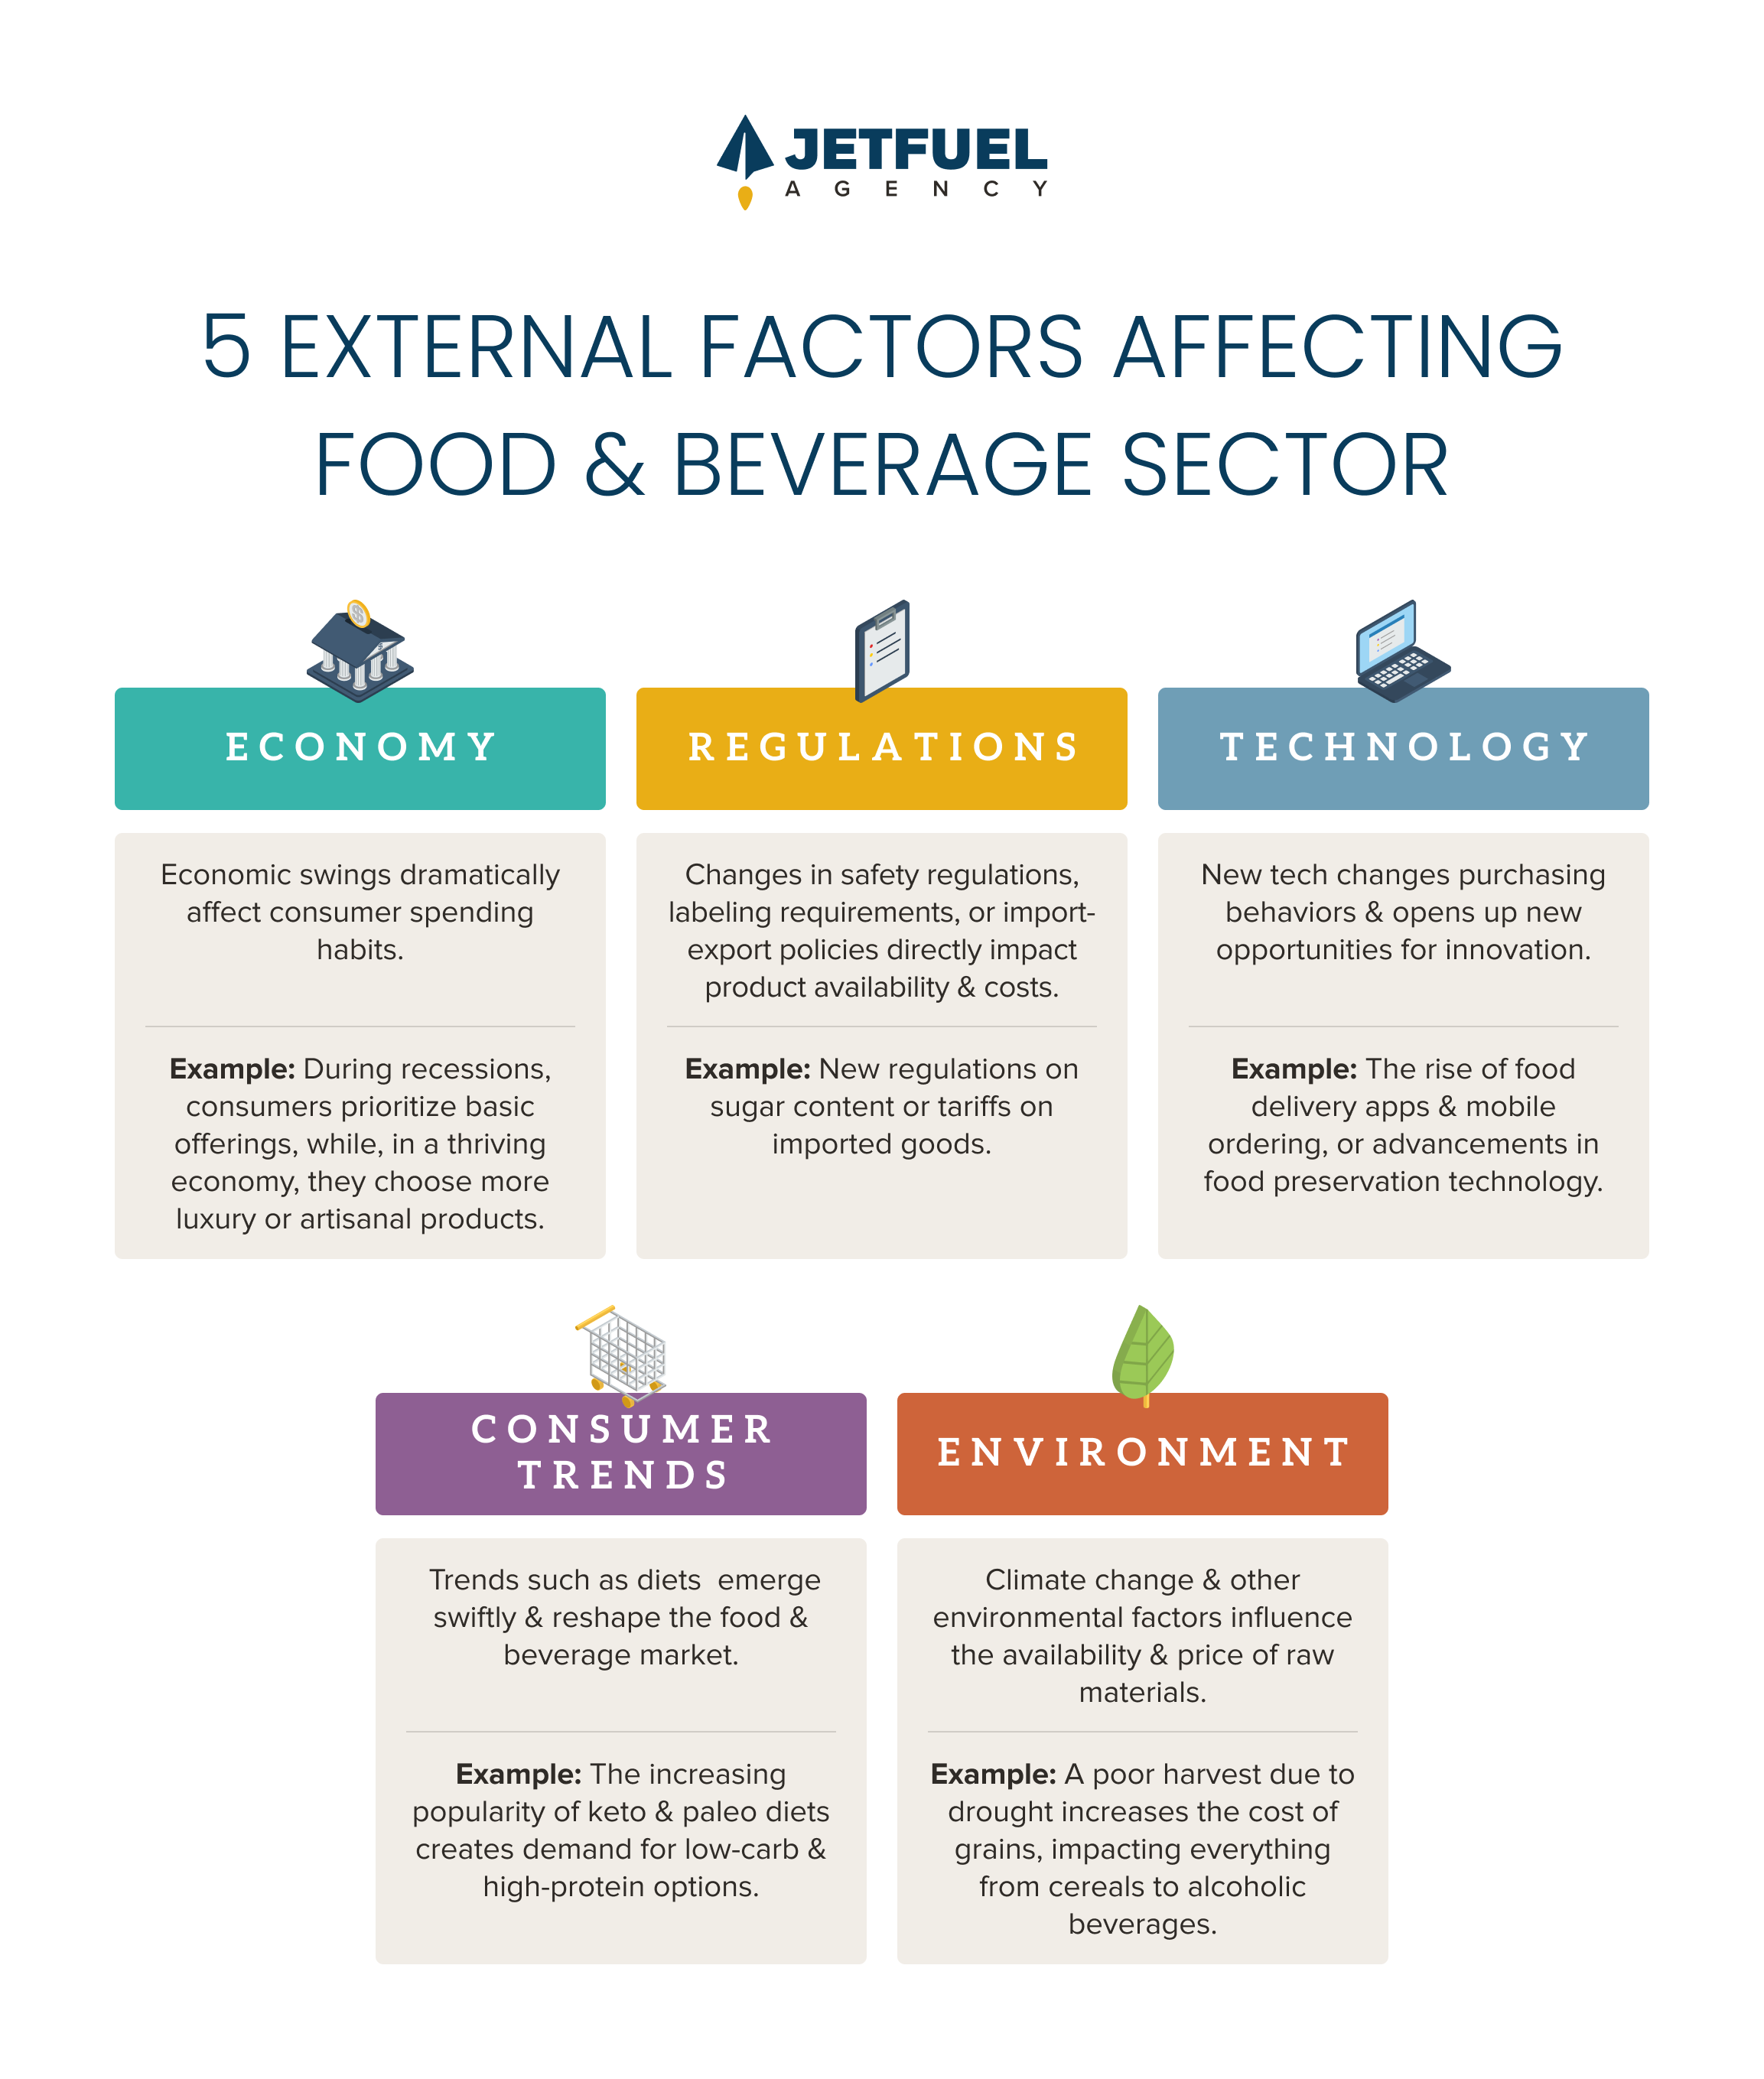
Food and beverage companies must factor these potential risks into their demand models to prepare for price fluctuations and supply chain disruptions.
By conducting a thorough and insightful analysis of your historical data, you equip yourself with the knowledge and foresight needed to build a robust demand forecasting model that drives success in the dynamic world of e-commerce.
2. Set Goals & Make Assumptions
SMART Goals
Start with a clear picture of your business's goals—not just wild percentage increases. What are you actually aiming for this year? Are you looking to increase market share, launch new products, or perhaps enhance customer retention?
Getting specific here is key, because “more money” isn’t a strategy. It’s important to set specific, measurable, attainable, relevant, and time-bound (SMART) goals. This clarity will not only guide your demand modeling efforts but also help you measure success down the line.

For example, a SMART goal for a food e-com brand would be a 5% increase in bottom-line revenue year over year.
Assumptions
It’s not enough just to replicate last year’s performance for the following year’s plan. If the business is just maintaining the status quo, you’re just following the curve. But that’s not what we’re being asked to do. As our clients are always growth-oriented, we’re always expected to go above and beyond that curve. How do we do that?
For a start, we always make sure we have a strong set of data and attribution to build our assumption table. Attribution is critically important here, because, at the end of the day, if you know why a metric moves a certain way, for example, why your CTR goes up and down, you will know the reasoning behind it. You’re going to get very good at creating strong assumption tables.
Here’s an example of an assumption table we created for a monthly tactical plan:
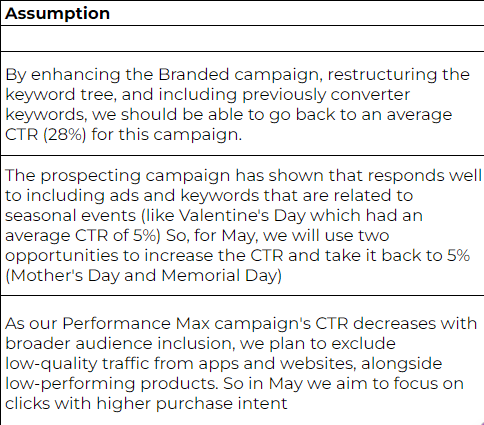
For example, if you plan to run twice as many A/B tests on your ad copy in May, and you know this typically boosts your click-through rate (CTR) by 0.3%, factor this into your projections. This kind of evidence-based assumption helps ensure your forecast is realistic and defendable.
Honestly, life isn't perfect, and neither is running a business. Make sure to cut all your numbers by 5-10% to account for unexpected disruptions and challenges.
Finally, make your model adaptable. Set up three scenarios—worst, expected, and best-case—and plan your strategies around them. The worst and best-case are not shown to the client, they are used internally, as we always want to be prepared for whatever comes our way.
This way, you're not just playing darts blindfolded; you're making strategic decisions based on a comprehensive view of your business and the market. And honestly, this is how you set yourself up for success in the fast-paced world of e-commerce.
3. Align Platforms & Stakeholders
Whatever you model should be pretty close to what’s in our bank account. If we tell our boss we’re going to bring in a hundred thousand dollars, and then he looks into Shopify or their bank account and there’s fifty thousand dollars, there’s going to be a problem. But, how do we make sure these numbers are close together and accurate?
We usually consider a 10-12% discrepancy between Google Analytics and Shopify Analytics normal. More than a 15% difference in numbers requires attention and fixing the issue.
| Cause of Data Discrepancy: | Explanation: |
| Attribution Models | Shopify, GA4, Google Ads and Meta are using different attribution models (first-click, last-click, data-driven, etc...) and lookback windows (7-day, 30-day to 90-day), click or view-through |
| Tracking Methods | Shopify, GA4, Google Ads, and Meta are using different attribution models (first-click, last-click, data-driven, etc...) and lookback windows (7-day, 30-day to 90-day), click or view-through |
| Platform-specific metrics and definitions | Platforms don’t define and calculate metrics the same way: "Sessions," "visits," or "engagements" “Conversions”, “transactions” and “sales” |
| TIME Zones and Data Lag | Meta Ads Reporting may operate in a different time zone Data processing lag between Meta, G.Ads, and third-party tools |
| Technical Issues | Incorrect tag/pixel installation Faulty conversion counting GA4 setup issues Ad blockers, VPNs, or private browsers Customers in a hurry don’t load the thank-you page |
How to align data from different platforms?
- Understand each platform's data collection methods
- Compare metrics and definitions
- Regularly review and reconcile data
- Implement third-party tracking tools
- Prioritize data accuracy and consistency
Finally, ensure all key stakeholders are on board with the defined objectives and the approach. This includes everyone from your marketing team and sales force to supply chain management and executive leadership. Alignment across the board is crucial for a cohesive and unified strategy implementation. Regular meetings and updates can help keep everyone informed and engaged with the demand modeling process.
| "In the dynamic world of food and beverage e-commerce, breaking down your overarching business goals into smaller, manageable objectives is crucial." |
This approach involves setting specific micro-goals that are achievable for everyone involved. Establishing clear Key Performance Indicators (KPIs) for each department, team, and individual ensures that everyone’s efforts are synchronized and contribute to the larger company objectives.
A Good Demand Model is Crucial for Your Business
In the fast-paced and ever-changing food and beverage industry, growing sustainably isn’t just about grabbing quick opportunities; it’s also about preparing for future challenges. This balance is best managed through strong demand modeling which is crucial for making smart, data-driven decisions. It helps businesses predict market trends, adjust to shifting consumer preferences, and allocate resources efficiently. This kind of foresight and flexibility is key to staying competitive and driving long-term growth.
The insights in this blog post are meant to encourage food and beverage companies to take another look at their current strategies. With the advanced techniques and practical tips shared here, businesses can improve their demand modeling processes and overall strategic planning. This means better conversion rates, managing acquisition costs, and boosting customer engagement, all of which connect back to a solid demand model.
As the industry faces new challenges and opportunities, the ability to quickly adapt and respond with smart demand modeling will set the leaders apart from the followers. It’s crucial for decision-makers to keep evaluating and refining their modeling strategies to stay ahead.
To all the food and beverage companies aiming for growth: take a fresh look at your demand modeling approach, use the latest analytics tools, and stay flexible in your planning. The future isn’t just about reacting to changes—it’s about predicting and preparing for them. Make strong demand modeling the cornerstone of your strategy, and watch your business thrive in a competitive market.
Ready to Optimize Your E-commerce Strategy?
Navigating the complexities of the food and beverage market requires more than just industry knowledge—it demands a proactive approach to demand modeling and strategic planning. If you're looking to enhance your e-commerce strategy, our agency is here to help.
At jetfuel.agency, we specialize in turning data into actionable insights that drive growth and efficiency. Our expert team is adept at crafting customized strategies that align with your unique business needs and market dynamics. Whether you're looking to refine your demand modeling, optimize conversion rates, or effectively manage your customer acquisition costs, we have the tools and expertise to assist you.
Take the first step towards transforming your e-commerce approach. We look forward to partnering with you for success!
