
Google Ads for Ecommerce: The Complete 2026 Scaling Guide
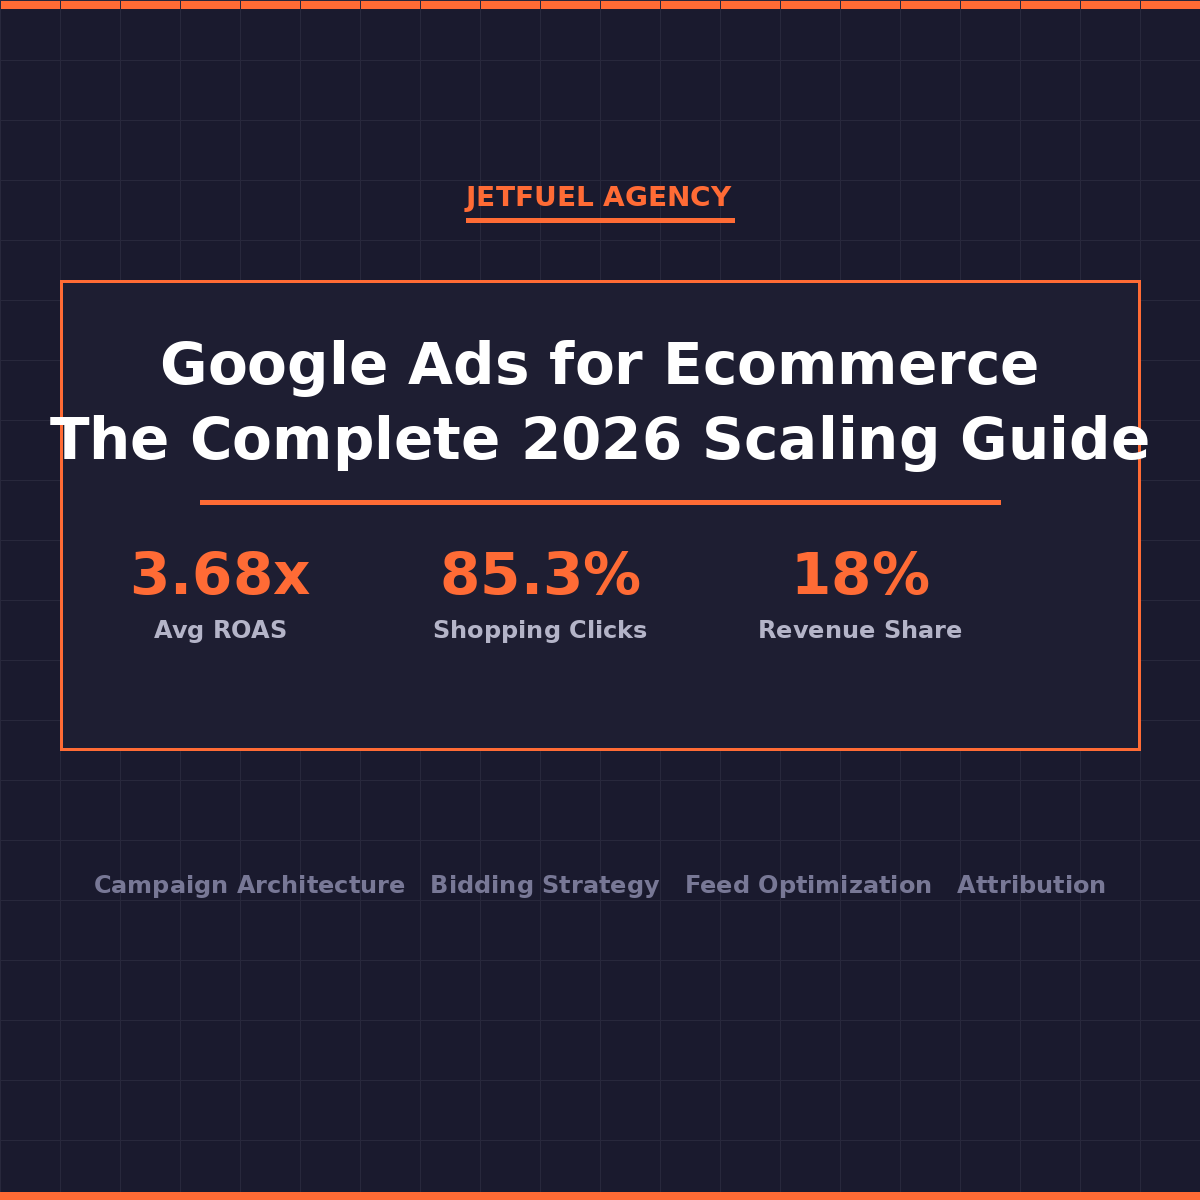
Google Ads is still the single most reliable paid channel for ecommerce brands that want to capture in-market buyers at scale. Across the 18,000+ brands tracked by Triple Whale, the average ecommerce ROAS from Google Ads sits at 3.68:1 — but brands running the right structure consistently outperform that benchmark by 40 to 60 percent. The difference is not budget. It is architecture.
This guide covers how we build and scale Google Ads accounts at Jetfuel for food, beverage, and ecommerce brands. We will cover the frameworks, bidding decisions, feed strategy, and attribution setup that separate accounts that compound over time from those that plateau.
Key Takeaways
- Google Shopping drives 85.3% of all Google Ads clicks for ecommerce. Getting your Shopping campaigns right is the highest-leverage move you can make.
- The Three-Layer ROAS Stack (Foundation, Acceleration, Amplification) is the campaign architecture we use across every Jetfuel ecommerce account. Each layer serves a different job.
- Product tiering matters more than budget. Running all products in one campaign tells the algorithm nothing. Splitting into Superstars, Workhorses, and Scouts unlocks the data you need to scale.
- Performance Max averages 2.57:1 ROAS vs. Search at 5.17:1. PMax is not a replacement for Search. It is a different tool for a different job.
- Attribution on default settings is almost certainly wrong. The 7-day click / 1-day view window inflates Google's contribution and kills your ability to allocate budget across platforms accurately.
Why Google Ads Still Wins for Ecommerce in 2026
Brands that write off Google Ads in favor of Meta or TikTok are making the same mistake in reverse. Google captures intent. Meta manufactures it. Both are necessary, but they serve different moments in the customer journey. When someone searches "organic protein powder for runners," they are ready to buy. Google puts you in front of that buyer. No other platform does that at scale.
According to Store Growers, Google Ads accounts for roughly 18% of total ecommerce revenue across brands running paid channels. That number holds even as social commerce grows. The reason: search intent is still the highest-converting traffic source in ecommerce, and Google owns 90%+ of that market.
The caveat: Google Ads performance varies wildly by account structure. We regularly inherit accounts where the previous setup had one Shopping campaign running all 300 SKUs on a single daily budget. The algorithm has no signal on which products to prioritize, so it spreads spend evenly across margin-crushers and bestsellers alike. That is not a budget problem. It is an architecture problem.
The average Google Shopping CPC sits at $0.66 (industry average). But CPC is the wrong metric to optimize. At $0.66 per click with a 3% conversion rate and a $65 average order value, your ROAS is 2.96x before a single optimization. The question is how high you can push conversion rate and average order value through better structure, better creatives, and better targeting. That is the game.
The Three-Layer ROAS Stack
Most brands treat Google Ads like a single channel. It is not. It is three overlapping channels that need to work together: demand capture (Shopping and Performance Max), brand defense (Brand Search), and demand expansion (Non-Brand Search). We call this the Three-Layer ROAS Stack.
Each layer serves a different purpose. Pulling budget from one to fund another is like robbing Peter to pay Paul. The brands that win on Google maintain all three layers and optimize each independently.
| Layer | Campaign Types | Primary Goal | Budget % | Target ROAS |
|---|---|---|---|---|
| Foundation | Shopping, Performance Max | Capture in-market demand | 55-65% | 2.5x - 4x |
| Acceleration | Brand Search, Brand Shopping | Protect brand equity, own SERP | 10-15% | 6x - 12x |
| Amplification | Non-Brand Search, DSA | Expand reach, capture new buyers | 20-30% | 3x - 5x |
Brand Search consistently runs 6x to 12x ROAS because these are customers already familiar with your brand. They are the cheapest conversions in the account. Many brands under-invest here because the ROAS looks "easy" and they want to put more into prospecting. That is backwards. Protect your brand first, then expand.
Campaign Tiering: How to Organize Your Product Catalog
Most brands put all their products in one Shopping campaign. Then they wonder why their ROAS is mediocre. The algorithm cannot figure out which products are winners when they are all competing for the same daily budget. You have to tell it.
We use what we call the Campaign Tiering Method: three product buckets based on revenue contribution and data maturity. Each tier gets its own campaign, its own budget, and its own ROAS target.
| Tier | Products Included | Budget Priority | Bidding Strategy | Optimization Focus |
|---|---|---|---|---|
| Superstars | Top 20% revenue drivers, proven converters | Highest (50-60% of Shopping budget) | Target ROAS (aggressive) | Maximize impression share, defend position |
| Workhorses | Mid-tier performers, consistent ROAS | Medium (30-40% of Shopping budget) | Target ROAS (efficiency focus) | Improve feed quality, test price adjustments |
| Scouts | New SKUs, untested, or low-data products | Low (10-15% of Shopping budget) | Maximize Clicks or manual CPC | Generate conversion data before promoting |
The Scout tier is often overlooked. New products need conversion data before the algorithm can optimize for them. Dropping a new SKU into your Superstar campaign and wondering why it underperforms is not a product problem. The algorithm simply does not have enough signal. Give Scouts their own campaign and their own budget for 30 days before making any promotion decisions.
Performance Max vs. Standard Shopping in 2026
Performance Max (PMax) is Google's AI-first campaign type. It runs across all Google surfaces — Search, Shopping, YouTube, Display, Discover, Gmail — and optimizes toward your conversion goals automatically. Google has been pushing hard for PMax adoption. That does not mean it is always the right tool.
According to Triple Whale's 2025 benchmark report across 18,000 ecommerce brands, Search campaigns average 5.17:1 ROAS while Performance Max averages 2.57:1. PMax's lower ROAS is not a failure. It is doing a different job: broader reach, upper-funnel inventory, and new audience prospecting. The mistake is treating PMax as a replacement for Shopping.
| Dimension | Performance Max | Standard Shopping |
|---|---|---|
| Average ROAS | 2.57:1 (Triple Whale 2025) | 5.17:1 (Triple Whale 2025) |
| Inventory Coverage | All Google surfaces (Search, YouTube, Display, Discover) | Shopping results only |
| Control Level | Low (AI-driven, limited override) | High (manual bidding, product groups, exclusions) |
| Best For | Brands with 50+ conversions/month, large product catalogs, mature accounts | Tight ROAS control, Superstar products, brand with clear product hierarchy |
| Feed Requirement | Product feed + creative assets required | Product feed only |
| Transparency | Limited (search term reports restricted) | Full search term visibility |
Our recommendation for most DTC ecommerce brands: run Standard Shopping for your Superstar and Workhorse tiers (where you want ROAS control), and use Performance Max for your Scout tier and new product launches (where broader reach and data generation matter more than short-term efficiency). Run them simultaneously with proper exclusions to prevent cannibalization.
Bidding Strategy Decision Matrix
Bidding is where most brands make their biggest mistakes. They switch to Target ROAS too early (not enough conversion data), set the ROAS target too high (budget is throttled), or use the wrong strategy for their account stage entirely. The right bidding strategy depends on where your account is, not where you want it to be.
| Account Stage | Monthly Conversions | Recommended Strategy | Rationale |
|---|---|---|---|
| New / Learning | Under 30 | Maximize Clicks or Manual CPC | Not enough data for smart bidding. Focus on traffic volume and data collection first. |
| Growing | 30 - 80 | Maximize Conversions (no target) | Let the algorithm find conversion patterns before constraining it with a ROAS target. |
| Established | 80 - 200 | Target ROAS (start at -20% of actual) | Enough data to constrain. Set target 20% below actual ROAS to avoid over-restricting spend. |
| Scaling | 200+ | Portfolio Target ROAS + Seasonality Adjustments | Portfolio bidding optimizes across campaigns simultaneously. Add seasonality adjustments for Q4, sale events, and promotional periods. |
One mistake we see constantly: setting a Target ROAS that is too high too early. If your account is delivering 4x ROAS and you set a 6x target, you are telling the algorithm to only bid on the highest-probability conversions. Budget gets throttled by 40 to 60 percent. ROAS goes up, revenue goes down. That is not optimization. That is a self-imposed ceiling.
The practical rule: set your Target ROAS at 80% of your current actual ROAS when first switching to smart bidding. Give it two to three weeks to stabilize. Then increase by 10% increments if results hold.
Product Feed Optimization: The Revenue Lever No One Talks About
Your product feed is your Shopping campaign's foundation. A bad feed limits your reach before you ever set a bid. Google's algorithm uses your product titles, descriptions, images, and attributes to determine when and where your ads appear. Most brands treat feed optimization as a one-time setup task. It is actually the highest-leverage ongoing optimization in a Shopping account.
We have seen feed improvements drive 25 to 40 percent increases in impression share without changing a single bid or budget. The algorithm surfaces your products more often because it finally understands what they are and who they are for.
Optimize Product Titles for Search Intent
Your title is your keyword. Put the most important search terms at the front. For a hot sauce brand: "Habanero Hot Sauce - Small Batch, Vegan, 5oz" outperforms "Fiery Joe's Original Blend" every time. Include: product type, key attribute, size/quantity, and brand name (in that order for non-brand campaigns).
Fill Every Optional Attribute
Google's algorithm uses optional attributes for targeting even when they do not appear in your ad. Flavor, material, pattern, age group, gender, condition — fill all of them. For food brands: add custom labels for dietary attributes (keto, vegan, gluten-free), flavor profiles, and seasonal relevance. These labels power your campaign segmentation too.
Use Supplemental Feeds for Dynamic Optimization
Your primary feed comes from Shopify or your CMS. Supplemental feeds let you layer in additional optimizations without changing your source data: updated titles for seasonal campaigns, custom labels based on margin or stock level, and promotional pricing overrides. DataFeedWatch and Feedonomics are the tools we use at Jetfuel for this.
Monitor Merchant Center Health Daily
Disapprovals and policy flags can silently kill your impression share. A feed with 15% disapproved products is running at 85% capacity at best. Check Merchant Center diagnostics weekly at minimum. Common culprits for food brands: unverified landing pages, price mismatches between feed and site, and missing GTIN codes on branded items.
| Feed Mistake | Impact | Fix |
|---|---|---|
| Brand name in title position 1 | Low match rate on non-brand queries | Move product type to position 1, brand to end |
| Missing GTINs on branded products | Disapprovals, reduced ad serving | Source GTINs from brand or UPC database |
| Price mismatch (feed vs. site) | Policy violation, possible suspension | Enable automatic price updates in Merchant Center |
| Generic product descriptions | Lower relevance scores, reduced impression share | Add 500+ character descriptions with attributes, ingredients, use cases |
| No lifestyle images | Lower CTR vs. competitors with lifestyle imagery | Add additional_image_link with lifestyle photos |
Attribution: Measuring What Actually Drives Revenue
Attribution is where Google Ads data becomes misleading for most ecommerce brands. Google's default attribution window is 7-day click / 1-day view. That means Google takes credit for any conversion that happens within 7 days of someone clicking your ad, even if that customer interacted with 4 other touchpoints before buying.
For brands running both Google and Meta simultaneously, this creates double-counting. Google says ROAS is 4x. Meta says ROAS is 3.5x. Your actual blended ROAS (total revenue divided by total ad spend) is 2.8x. Neither platform is lying. They are both counting differently. The gap between platform-reported ROAS and true blended ROAS is often 30 to 50 percent.
| Attribution Window | What It Counts | When to Use | ROAS Impact vs. Default |
|---|---|---|---|
| 7-day click / 1-day view (default) | All conversions within 7 days of any click | Baseline only, not for budget decisions | Highest (most inflated) |
| 1-day click / 0-day view | Only same-day conversions after clicks | Short purchase cycle products (impulse buys) | Lowest (most conservative) |
| Data-driven attribution | ML-weighted credit across all touchpoints | Accounts with 300+ conversions/month | Moderate (most accurate for bidding) |
| MER (blended ROAS) | Total revenue / total ad spend across all channels | Cross-platform budget allocation decisions | True north metric |
Our recommendation: switch from last-click to data-driven attribution as soon as your account hits 300 monthly conversions. Before that threshold, use 1-day click / 0-day view for your actual bidding decisions, and treat 7-day numbers as directional only. Most importantly, use Marketing Efficiency Ratio (total revenue divided by total ad spend) as your real budget allocation signal across channels.
Budget Allocation by Revenue Stage
Budget allocation is one of the most common questions we get. How much of our Google Ads budget goes to Shopping vs. Search vs. Brand? The answer changes based on where you are in your growth trajectory. A $200K/year brand has different priorities than a $2M/year brand.
| Revenue Stage | Shopping / PMax | Brand Search | Non-Brand Search | Display / YouTube |
|---|---|---|---|---|
| Under $500K/yr | 70% | 15% | 15% | 0% |
| $500K - $2M/yr | 55% | 15% | 25% | 5% |
| $2M - $10M/yr | 50% | 10% | 30% | 10% |
| $10M+/yr | 40% | 10% | 30% | 20% |
Under $500K, there is no good reason to run Display or YouTube. You do not have the budget scale to generate meaningful data or impact, and the CPA is too high relative to Shopping's efficiency. Put every dollar into demand capture and protecting your brand terms. Layer in Display and YouTube once you have Shopping running profitably and you need a new growth lever.
As you scale past $2M, Non-Brand Search earns a larger share because you have the data to make it work. Non-brand keywords (e.g., "organic protein powder," "hot sauce gift set") are more expensive and lower-converting than brand terms, but they bring in net-new buyers your Shopping campaigns may not reach. At scale, that growth lever matters.
The 72-Hour Optimization Loop
How often should you make changes to your Google Ads account? The instinct is "daily." The right answer is every 72 hours. Daily changes starve the algorithm of the time it needs to learn from adjustments. Making a bid change on Monday and another on Tuesday means neither change has meaningful data behind it.
The 72-Hour Optimization Loop is the cadence we use across all Jetfuel accounts. One review, one change category per review, documented before and after.
Pull 72-Hour Performance Snapshot
Look at clicks, conversions, CPA, and ROAS for the past 72 hours at the campaign and ad group level. Compare to the prior 72-hour period and to your 30-day rolling average. Note anything more than 20% different from the baseline. That is your signal.
Choose One Change Category
Make only one type of change per review cycle: bidding adjustment, budget reallocation, negative keyword addition, audience bid modifier, or feed update. Making multiple change types simultaneously makes it impossible to know which change drove the result. Document your hypothesis before making the change.
Log the Change with Timestamp
Use Google Ads' built-in change history or an external log (we use a simple Google Sheet). Record: date, campaign, what you changed, why you changed it, and expected impact. This log is the most underrated tool in account management. When performance dips three weeks later, you can trace it to a specific change rather than guessing.
Review Negative Keywords Weekly
Pull your search terms report weekly and add negatives for any irrelevant terms that generated spend with zero conversions. For food brands, common wasted spend terms include recipe searches ("best habanero sauce recipe"), competitor navigational queries you do not want to pay for, and broad match spillover to unrelated categories. Build a shared negative keyword list across all campaigns.
Google Ads + Meta Ads: Complementary, Not Competing
The most common budget argument we see: "Should we put more into Google or Meta?" It is the wrong question. Google and Meta serve different stages of the customer journey. Running both well is almost always more efficient than going all-in on one.
Google captures existing demand. Meta creates new demand. If you are a newer brand with low search volume for your category or product type, Google will underperform simply because there are not enough people searching. Meta can reach cold audiences and build awareness that eventually flows into Google search volume. That is the flywheel.
| Campaign Goal | Best Platform | Why |
|---|---|---|
| Capture in-market buyers now | Google (Shopping / Search) | Search intent signals are unmatched for ready-to-buy customers |
| Introduce brand to new audiences | Meta (Advantage+, Broad) | Visual ad formats + demographic + interest targeting outperforms Google for cold prospecting |
| Retarget site visitors / cart abandoners | Meta (Dynamic Product Ads) | Meta's retargeting creative formats (video, carousel) drive stronger re-engagement than Google Display |
| Protect brand search terms | Google (Brand Search) | Competitors can bid on your brand name; own your SERP |
| Video / content-driven awareness | Meta + YouTube | Both outperform Google Display for awareness at cost-per-view efficiency |
| Subscription / LTV optimization | Meta (Customer List Targeting) | Upload CRM segments to Meta for LTV-based lookalike building; Google Customer Match works but smaller reach |
The practical test: if you pause Google Ads for two weeks, does your site traffic from organic and direct channels hold up? If brand search volume drops significantly, Google Shopping and Brand Search were generating the demand your other channels were capturing. They are not just conversion tools. They are demand drivers.
Frequently Asked Questions
How much budget do I need to start Google Ads for ecommerce?
The minimum viable daily budget for a Shopping campaign is around $30 to $50/day. Below that, you will not generate enough clicks to build conversion data within a reasonable timeframe. For brands just starting out, we recommend a total monthly Google Ads budget of $1,500 to $3,000 to generate statistically meaningful data within 60 days. Below $1,000/month, the algorithm's learning period stretches too long and you will struggle to exit the "learning" phase where performance is inconsistent.
Should I use Performance Max or Standard Shopping for my ecommerce brand?
Use both, but for different product groups. Run Standard Shopping for your proven bestsellers (Superstars and Workhorses) where ROAS control matters most. Use Performance Max for new products, seasonal launches, and your Scout tier where broader reach and data generation are the goal. Accounts with 50+ monthly conversions can lean more into PMax for the AI advantages. Accounts under that threshold typically see better efficiency with Standard Shopping where you control bidding directly.
What is a good ROAS for Google Ads ecommerce?
The industry average ecommerce ROAS from Google Ads sits at 3.68:1 across 18,000+ brands (Triple Whale 2025). But ROAS is not the right target metric without context. A 3x ROAS on a 70% margin product is very profitable. A 5x ROAS on a 25% margin product might not break even after COGS, shipping, and returns. Set your ROAS target based on your break-even ROAS calculation: revenue needed to cover your gross margin percentage. Most brands should target a blended ROAS (total ad spend, all campaigns) of 2.5x to 4x depending on their category and margin structure.
Why is my Google Shopping ROAS good but my overall revenue isn't growing?
This is the most common scaling plateau we see. When your Target ROAS is set too high, the algorithm only bids on the highest-probability conversions — your best customers who were going to buy anyway. ROAS looks great. Revenue stays flat. The fix is to lower your Target ROAS by 15 to 20% and let the algorithm pursue lower-probability conversions that it was previously ignoring. Yes, your reported ROAS will drop. But revenue and new customer acquisition should increase. Track Marketing Efficiency Ratio (total revenue divided by total ad spend) as your real growth metric, not platform ROAS.
How long does it take for Google Ads to start performing for an ecommerce brand?
Smart bidding campaigns enter a "learning" phase that typically lasts 1 to 4 weeks. During this period, ROAS is often inconsistent and CPA is elevated. Do not make major changes during the learning phase — it resets the clock. For most ecommerce brands, expect 60 to 90 days before you have enough data to make confident optimization decisions. Brands spending less than $1,500/month will see the learning period extended further because fewer clicks slow down data accumulation. Plan your evaluation timeline accordingly and resist the urge to pause or restructure before you have meaningful data.
Google Ads for ecommerce rewards structure, patience, and precision over raw budget. The brands we see compounding month over month are the ones that invest in account architecture upfront, use the right bidding strategy for their stage, optimize their feed continuously, and measure with honest attribution. Every one of those is a controllable variable. The budget is the last lever, not the first.
If your account is stuck at a plateau, the problem is almost always structural: wrong campaign architecture, mismatched bidding strategy, or attribution that is inflating numbers and driving bad budget decisions. Fix the structure first. Scale the budget second.
Launch into Success
Tell us a bit about yourself and your business. We are just one message away from the perfect partnership!