E-commerce finance might sound abstract, but it’s essential to grasp its concepts to drive success as we approach 2025. From CEOs to VPs, everyone in e-commerce is judged on financial results, and understanding key metrics like ROIC, CAC, and LTV can make you a strategic partner rather than just a service provider.
In this guide, we break down the metrics that matter most, from cash flow management to inventory turnover, and show how to use them to enhance your client’s financial health.
Table of contents:
- What Makes a Company Valuable? 4 Essential Metrics
- How to Measure E-commerce Success with 8 Financial Metrics
- How to Retain Investor Trust Despite Financial Setbacks—Wayfair's Strategy
- How to Drive Both Top-Line and Bottom-Line Growth
- Understanding CAC Payback Period and Lifetime Value (LTV)
- Final Recap: Driving Growth with Key E-commerce Metrics
What Makes a Company Valuable? 4 Essential Metrics
When it comes to measuring how valuable a company really is, these key metrics stand out: ROIC/ROE, Inventory Turnover, Cash Flow and Profit & Loss. Let's break them down in a way that shows how they're relevant to the work you're doing every day.
1. Return on Invested Capital (ROIC) / Return on Equity (ROE)
ROIC and ROE are all about how much return your clients are getting for every dollar they invest. Think of it like this: if they spend $1 on something, how much profit do they get back in return? This is the question that's always on their mind—whether they're thinking about hiring your agency or investing in a new project.
Take Amazon as an example. They spent years putting their profits back into the business, growing like crazy even though they weren't turning a profit for over a decade. Why? Because investors believed that the money Amazon was reinvesting was going to pay off big in the future. And they were right. This is what ROIC is all about—how well that invested money helps grow the company in the long run.
For your clients, this can mean that even if results aren't amazing this month, you can show that the work you're doing (whether it's creative or technical) is a stepping stone to something bigger. By explaining this concept, you help your clients understand that what may seem like a short-term loss could be paving the way for long-term success.
2. Inventory Turnover
Next up is inventory turnover, which is a big deal for e-commerce clients, especially those selling physical products like food. If your client's products aren't moving quickly enough, their inventory sits on shelves and can expire, meaning they're losing money just by holding onto it.
Imagine your client has stocked up on seasonal items like pumpkin-flavored snacks for the fall. If those products don't sell fast enough, they expire, and your client's literally throwing money away. When they push you to sell more, it's because slow inventory turnover can crush their profits. So when they're talking about the need to boost sales for a specific product, it's likely because they've put a lot of money into it and need to move it fast before it loses value.
3. Cash Flow
Cash flow is the lifeblood of any business, and it's possible for a company to be profitable on paper but strapped for cash in reality. This happens a lot in e-commerce, where businesses might have long wait times before they get paid. For example, many of your clients sell through grocery stores, which might take 120 or even 180 days to pay them for inventory. In the meantime, your client has to cover all their expenses—paying for ads, staff, and more—without seeing the cash from their sales.
Even if things look good in a report, your client might be struggling to keep cash in the bank, and that's why they could be feeling the squeeze. When you understand their cash flow challenges, it makes it easier to work with them to adjust strategies or spend more wisely in the short term.
4. Profit and Loss
Finally, there's profit and loss, which is pretty straightforward: is the business making more money than it's spending? This metric ties into everything you're working on, from customer acquisition to ad spend. It helps you understand the bigger picture of whether the strategies you're using are contributing to the overall profitability of the business.
If they're not profitable, it's often time to rethink how much they're spending to acquire customers (like focusing on lowering their CAC) or find ways to improve efficiency elsewhere. This is why discussions around spending and strategy are so critical—you're not just helping them grow, but also making sure they're not bleeding money along the way.
These metrics—ROIC, inventory turnover, cash flow, and profitability—are crucial in determining the long-term value of an e-commerce business. By focusing on these areas, companies can ensure they're not just surviving, but thriving in an increasingly competitive market.
How to Measure E-commerce Success with 8 Financial Metrics
Let's go over some of the key terms that pop up in our day-to-day discussions with clients. These are the buzzwords we use all the time, and they're critical to understanding whether a direct-to-consumer business is truly profitable.
Let's break down the most important definitions and metrics that can help us align platform reports with actual financial impact: Interface Revenue, Reporting Discount Factor, CR, COGS, Cost of Servicing an Order, CAC, ERS and Top-Line & Bottom-Line Revenue.
1. Interface Revenue
When you see revenue numbers in each platform's reporting dashboard like Google, Facebook, or TikTok, that's what we call interface revenue. These are the numbers reported by the advertising channels, but they can be misleading. Why? Because each platform likes to claim as much credit as possible for sales to get you to spend more.
For example, Google might say your campaign drove $100,000 in sales, while Facebook also claims $100,000. But when the client checks their bank account, they only see $150,000 total, not the $200,000 the platforms claim.
Since these platform numbers don’t always match the actual revenue, we need a way to adjust for that inflation. That’s where the reporting discount factor comes in—it helps us bring those reported numbers closer to what’s really hitting the bank.
2. Reporting Discount Factor
The reporting discount factor is what we use to adjust the platform-reported revenue (interface revenue) to match the actual money in the client's account. For every client, we take the numbers from all channels and apply a discount factor to bring those inflated figures closer to reality.
This step is critical because we can't make smart decisions without knowing the real financial impact. Sure, we make decisions based on the platform data, but without aligning it with the actual finances, we'd risk overspending or misjudging performance. The reporting discount factor helps ensure that our strategies are based on what's truly happening, not just what the platforms report.
Actionable tip: Calculate your reporting discount factor by comparing platform-reported revenue to actual revenue from each channel. For instance, if Google claims $100,000 and your actual revenue is $80,000, apply a 20% discount factor to future Google-reported numbers.
3. Conversion Rate (CR)
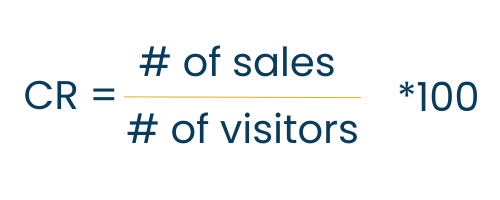
The conversion rate is one of the most critical metrics to track. It's calculated by dividing the number of conversions (sales, sign-ups, etc.) by the number of visitors to the site.

For example, if 10 people out of 100 visitors make a purchase, the conversion rate is 10%.
This metric is so powerful because improving it increases both top-line (total revenue) and bottom-line (profit) numbers, making it a key driver of a healthy P&L. The higher the conversion rate, the more effective your site or campaigns are at turning visitors into customers, which makes it a powerful lever for optimizing business performance.
Learn all about how to boost your conversion rates with expert optimization strategies.
4. Cost of Goods Sold (COGS) & Gross Margin (GM%)
Cost of Goods Sold (COGS) represents the cost to produce the products your client sells.

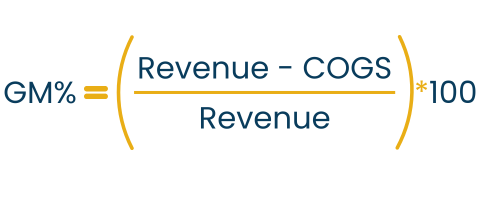
Gross Margin % indicates the percentage of revenue remaining after accounting for the COGS. It reflects how efficiently a company produces or sources its products in relation to its sales.

For example, if they sell a product for $20 and it costs $10 to produce, the COGS is $10. This leaves a gross profit of $10, and the gross margin would be 50%.
Knowing the COGS is important because different products can have vastly different margins. Some might have thin margins of just 5%, while others might generate a 70% margin. This directly affects how and where to allocate spending for promotions or advertising.
5. Cost of Servicing an Order
E-commerce businesses also need to factor in the cost of servicing an order. This includes returns, cancellations, and the logistics of picking, packing, and shipping products. In food & beverage vertical, the returns usually average 2-3% of total sales.

For some companies, like those that ship perishable food items, shipping costs can run as high as $17 per order due to special packaging requirements. These operational costs can take a significant bite out of overall profits, so it's important to track and manage them carefully.

6. Customer Acquisition Cost (CAC)
CAC tells you how much it costs to acquire a new customer. If your client spends $50 in ads to get one customer, that's their CAC.

The goal is to keep CAC as low as possible while still bringing in valuable customers. It's critical to balance the cost of acquiring customers with how much those customers will ultimately spend over their lifetime (which ties into LTV, or Lifetime Value).
7. Earned Revenue Spend (ERS) and ROAS (Return on Ad Spend)
Earned Revenue Spend (ERS) is a key metric that's the inverse of ROAS (Return on Ad Spend).

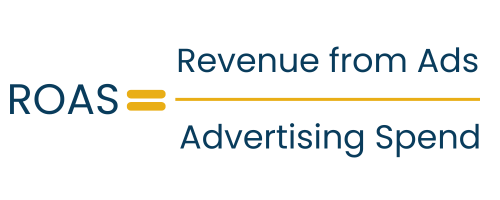
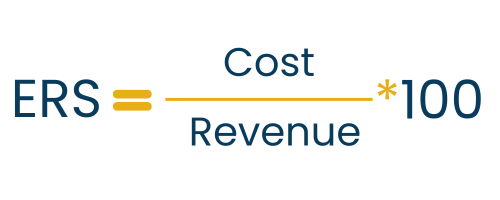
While ROAS tells you how much revenue you're earning for every dollar spent on ads, ERS focuses on the percentage of revenue that's spent to earn it. Essentially, it measures how efficiently you're using your ad budget.

For example, if your ROAS is 2x (you earn $2 for every $1 spent), your ERS would be 50%—meaning you're spending 50% of your revenue on acquiring customers. The lower the ERS, the more efficient your marketing efforts are.
Why does this matter? Because understanding ERS helps businesses know how much of their revenue is going toward marketing costs, giving a clearer picture of profitability. It's especially useful when evaluating CAC (Customer Acquisition Cost) and fine-tuning marketing strategies. A high ERS indicates you're spending a lot to earn each dollar, which could signal the need to optimize ad spend or improve conversion rates.
Tracking ERS gives clients a better understanding of their overall marketing efficiency and helps ensure they're balancing revenue growth with sustainable profit margins.
8. Top-Line vs. Bottom-Line Revenue
Top-line revenue refers to the total revenue a company generates—essentially, all the sales before any expenses are deducted. Bottom-line revenue, on the other hand, is the profit left after all expenses, including COGS, marketing costs, and administrative expenses, are accounted for. A company might have strong top-line revenue, but if their expenses are too high, their bottom line could suffer, leaving them with little profit.
For example, a client might have a 73% gross margin, meaning they keep 73% of every dollar made after covering COGS. But after factoring in marketing costs, returns, shipping, and overhead, that number can shrink significantly—sometimes leaving just 10% profit or less. This is why clients often react strongly to the idea of running deep discounts. If their profit margin is already thin, they simply can't afford to offer a 30% discount without cutting too deep into their earnings.
By mastering these important metrics—interface revenue, conversion rate, COGS, CAC, and understanding the difference between top-line and bottom-line revenue—you'll be in a much better position to make strategic decisions that drive real value for your clients. These numbers are the foundation of every campaign and promotion you run, and understanding how they all fit together ensures that your strategies contribute positively to both short-term wins and long-term growth.
How to Retain Investor Trust Despite Financial Setbacks—Wayfair's Strategy
Wayfair, a major name in e-commerce, offers a practical example of how to keep investor trust despite ongoing financial losses. Wayfair has faced challenges with profitability for years, which means it has to keep explaining its plan to investors. This level of transparency is crucial: by regularly sharing how they're working toward profitability, Wayfair manages to retain confidence even when facing setbacks.
Core Strategy: Growing Gross Margins
Wayfair's approach to turning a profit centers around increasing its gross margins. The company aims to grow margins through strategic moves like:
- Optimizing logistics: Cutting costs by making the supply chain more efficient.
- Expanding supplier services: Adding new services for suppliers to create extra revenue.
- Leveraging wholesale pricing: Using its size to negotiate better deals with suppliers.
E-commerce brands can adopt similar strategies to strengthen their margins, improving both efficiency and financial health.
The Importance of Investor Confidence
For any business, keeping investors on board means having a clear path to profitability. Wayfair maintains confidence by laying out its plan for future improvements, which builds credibility even when current profits aren't there.
This example highlights the need for e-commerce brands to communicate financial goals and show progress. Brands that clearly address how they'll handle financial hurdles—like high CAC or long payback periods—can keep investors engaged and avoid losing support.
How to Drive Both Top-Line and Bottom-Line Growth
When it comes to growth, we look at two areas: top-line (gross revenue) and bottom-line (profit). Top-line growth is about bringing in more revenue by attracting more customers, while bottom-line growth focuses on maximizing profit.
But you can't grow by focusing on profit alone—cutting costs won't drive growth. And chasing top-line revenue without profit isn't sustainable.
So, how can we achieve both top-line and bottom-line growth? The key lies in boosting conversion rates and AOV. By increasing these two KPIs, we can improve both revenue and profitability at the same time.
Here's a breakdown of how to practically tackle both sides of this equation in a way that drives ROI and creates strong value over time.
Top-Line Growth: Attracting Quality Traffic and Maximizing Revenue
The first step in growing revenue is pulling in high-quality traffic—customers who are more likely to buy. Here's how to do it:
- Focus on Consistent, Quality Traffic: Make sure you're investing in channels that bring engaged visitors. Think about refining your audience targeting to improve ad relevance and keep costs-per-click (CPC) or cost-per-thousand-impressions (CPM) down.
- Diversify Your Channels: Relying too much on one ad platform can be risky. Spread your campaigns across multiple channels—like Google, Meta, TikTok, and email marketing—to tap into different audiences and increase brand reach.
- Increase Conversion Rates and AOV Together: Conversion rates and AOV are pivotal because they drive both top-line and bottom-line growth. Here are key tactics to make the most of these metrics:
- Targeting and Personalization: Sharpen your targeting and personalize content to boost engagement. The more relevant your message is, the more likely visitors are to convert.
- Audience & Creative Testing: Constant testing helps fine-tune your approach. Test different audience segments and ad creatives to discover what resonates best and drives the lowest cost per conversion.
- Landing Page Optimization: Your landing pages are where visitors become buyers. Make sure they're user-friendly, fast-loading, and aligned with your ad messaging. Small tweaks can make a big impact on conversions, helping you capture more top-line revenue.
Bottom-Line Growth: Reducing Costs & Increasing Profitability
While it's great to pull in revenue, you also want to make sure those sales are profitable. This is where managing costs and promoting repeat purchases comes in:
- Lower Customer Acquisition Costs (CAC): Efficient spending is crucial. Continuously monitor ad performance to cut out channels or campaigns that aren't bringing a good return.
- Use Discounts Carefully: Discounts can help drive sales, but be cautious. Over-discounting can damage your profit margins and set up customer expectations for future sales. Instead, use discounts selectively as a short-term boost rather than a main strategy.
- Focus on Repeat Orders: Getting that second order is about 10x cheaper than acquiring a new customer. Invest in retention strategies—like loyalty programs and personalized email/SMS follow-ups—to bring customers back without the high cost of new customer acquisition.
- Think Holistically for CPG Brands: For Consumer Packaged Goods brands, balancing D2C with retail partnerships can help manage acquisition costs and broaden reach. Retail partnerships can support profitability while maintaining a strong D2C presence.
By focusing on both top-line and bottom-line strategies—and using conversion rates and AOV as your core metrics—you're setting up a balanced approach to growth. This focus helps maximize every marketing dollar, keeping ROI high and value strong over time.
Understanding CAC Payback Period and Lifetime Value (LTV)
For brands looking to grow, balancing short-term gains with long-term value is key. This is where payback period and Lifetime Value (LTV) come in. These metrics show whether a brand can grow sustainably and profitably. Let's look at two main approaches to the payback period and why they matter.
The Payback Period: Two Approaches
The payback period is simply how long it takes to recover the cost of acquiring a customer. Most e-commerce brands use one of these two approaches:
- Profit on the First Order
Some brands aim to make a profit on the very first purchase, meaning they want the payback period to be as close to zero as possible. This approach works well for businesses with higher-margin or big-ticket items. For example, a brand like WillyGoat, selling outdoor equipment for families, focuses on making money right away since customers might buy only once.- Pros: Quick profit, easy to measure, and lower risk.
- Cons: Limited growth potential since there may be a smaller customer base for higher-margin products.
- Profit on Repeat Orders
Other brands—especially those with consumable or lower-margin products—are willing to lose money on the first sale, betting that customers will come back. This model is common for CPG brands, which often need customers to make multiple purchases to turn a profit.- Pros: Bigger growth potential, more focus on building customer loyalty.
- Cons: Slower path to profitability and higher upfront costs, which means you need strong retention strategies to keep customers coming back.
Balancing Growth with Profitability
Knowing your payback period helps balance short-term cash needs with long-term growth goals. If you’re looking to shorten the payback period, consider these tips:
- Increase Touchpoints Early: Re-engage customers right after their first purchase through targeted email or SMS. This keeps your brand top-of-mind and encourages faster repeat purchases.
- Shorten the Buying Cycle: Make it easy for customers to come back soon by offering targeted product recommendations or discounts on their next purchase.
Lifetime Value (LTV): The Long-Term Metric
While the payback period is about recovering acquisition costs, LTV measures the total profit you can expect from each customer over time. A higher LTV means each customer brings more value to the brand. Brands that focus on boosting LTV can afford higher initial acquisition costs, knowing they'll make it back through repeat business.
Focusing on LTV is all about creating loyal, repeat customers who stick around. By balancing LTV with a manageable payback period, brands can set up for steady, sustainable growth.
Final Recap: Driving Growth with Key E-commerce Metrics
As we approach 2025, understanding and applying e-commerce finance fundamentals is more critical than ever for sustainable growth. Every decision you make—from ad spend to customer retention strategy—directly impacts your client's financial health. Metrics like Return on Invested Capital (ROIC), Customer Acquisition Cost (CAC), Lifetime Value (LTV), and Average Order Value (AOV) are essential for driving real, measurable results.
The key is balancing top-line growth (increasing revenue) with bottom-line profit (controlling costs) to ensure each marketing dollar maximizes both reach and profitability. By optimizing conversion rates and AOV, your efforts can boost both revenue and profit at once, building a foundation for long-term value.
As 2025 unfolds, take time to regularly review and analyze your financial metrics to stay aligned with your goals and your clients' growth targets. Use these insights to make adjustments, whether that’s refining a strategy, reallocating spend, or identifying areas for increased efficiency. Each of these metrics offers a new opportunity to strengthen your approach, deepen client relationships, and build a sustainable path in the competitive e-commerce landscape.
Think you’re ready to put your e-commerce finance knowledge to the test? See how much you remember and challenge yourself with this quick quiz!
